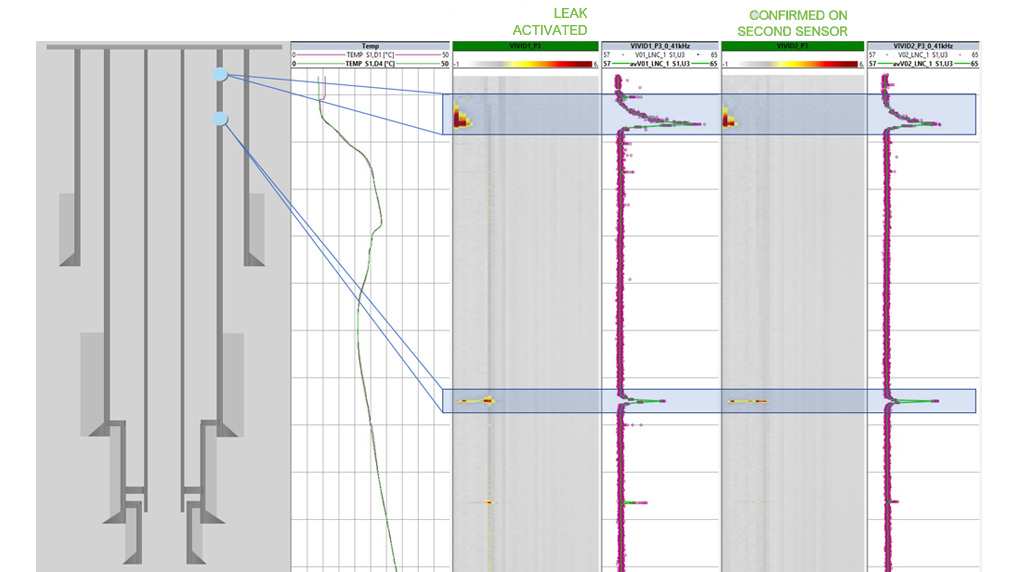
VIVID®
Leak Detection
Case Study 1
Verify cement integrity and find leak pathways behind multiple barriers, even when leaks are as small as a tablespoon a minute.
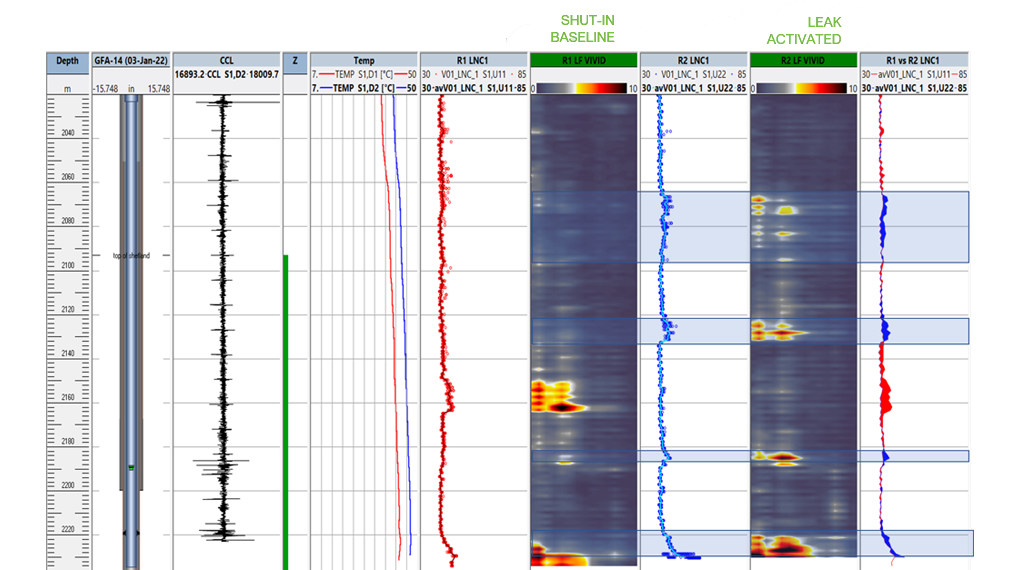
VIVID®
Leak Detection
Case Study 2
Identify leak locations and leak source pathways like cement channels, even when logged behind multiple barriers.
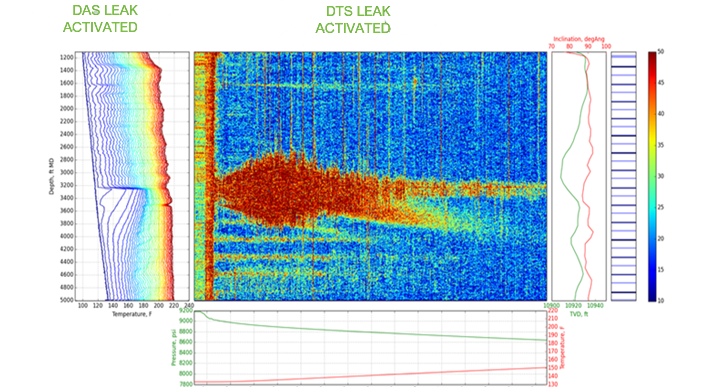
Leak Detection
Case Study 3
When plugs won’t pump down, immediately identify barrier isolation failures in unconventional horizontal wells by utilizing DAS & DTS to visualize the location and magnitude of leaks.
OFFSET FRAC MONITORING
Case Study 1
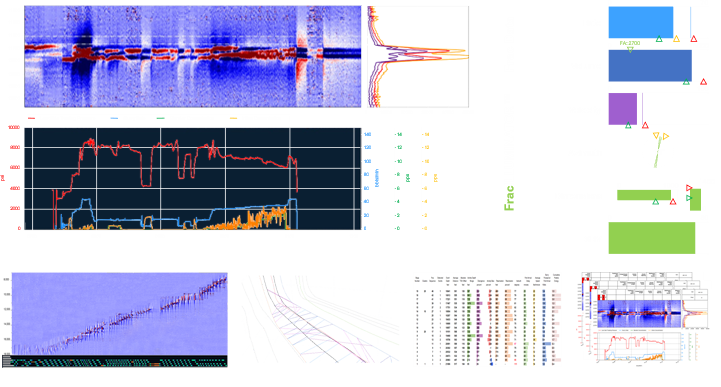
See where offset fractures intersect with monitored wells
Visualize the entire frac or zoom in on a single stage
Understand volume at first response, intensity, azimuth and time of arrival to differentiate between new frac growth and re-dilation of existing fractures
OFFSET FRAC MONITORING
Case Study 2
Offset fractures sometimes intersect with wells far beyond expectations.
Monitoring fiber during frac operations illuminates where wells may be connected and where reserves have been bypassed.

SPE-212336-MS How And Where Wells Talk: Integrating Cross-well Strain and Production Profile Interference Testing, Figure 7
INTERFERENCE WITH OFFSET WELL
Case Study 2
Understand how and where wells talk to each other.
Utilizing FracILLUMINATOR™ and FlowILLUMINATOR™ + in conjunction allows operators to compare the created fracture network to the hydraulically functional network.
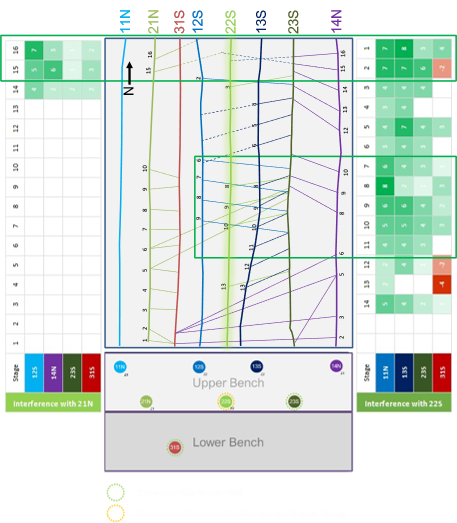
SPE-212336-MS How And Where Wells Talk: Integrating Cross-well Strain and Production Profile Interference Testing, Figure 7
FLOW ALLOCATION
Case Study 1
Understand how treatment impacts production with cluster level allocation of each.
Statistical analysis reveals heel/toe and lateral bias.

SPE-204188 Comparing and Combining Camera, Tracer and Distributed Temperature and Acoustic Sensing (DAS+DTS) for a Holistic Understanding of Stimulation and Production Performance
STIMULATION ALLOCATION
Case Study 1
DTS warm back data (1) differentiates between treated and untreaded clusters in each stage and
(2) highlights stage isolation failures.
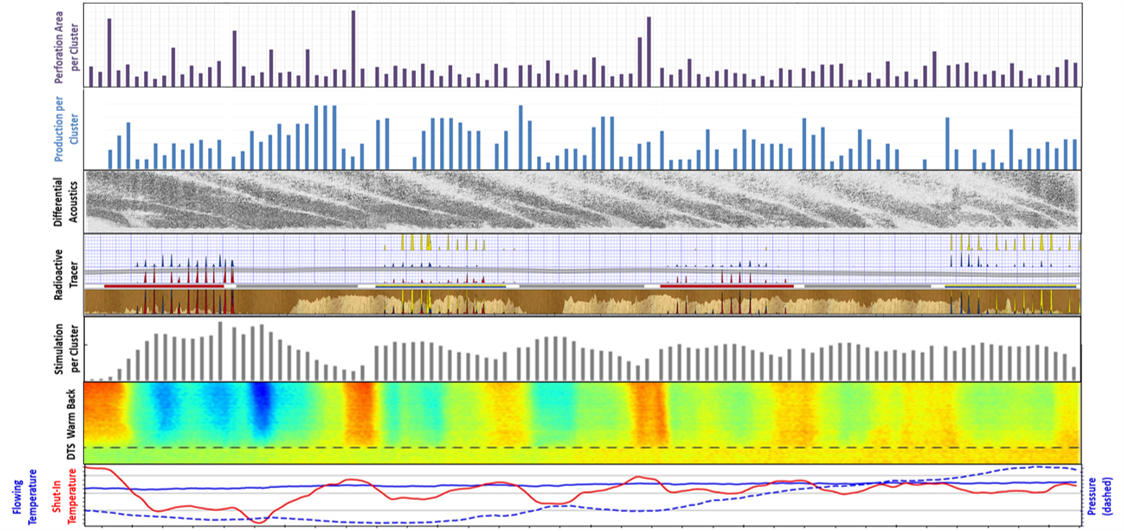
SPE-204188 Comparing and Combining Camera, Tracer and Distributed Temperature and Acoustic Sensing (DAS+DTS) for a Holistic Understanding of Stimulation and Production Performance
EVALUATE CLUSTER EFFICIENCY
Case Study 1
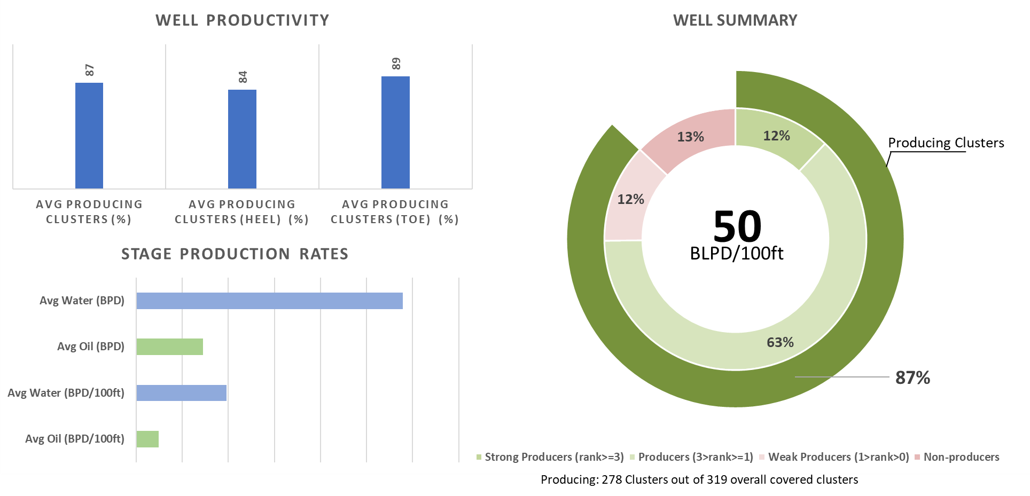
Cluster efficiency evaluation equips operators to make the best-informed decisions on well design and how factors like cluster and stage spacing, landing zone and stimulation uniformity influence production rates and uniformity.
Completion Efficiency Summary, indicating on average 9 out of 10 perforations are producing, with 2 out of 3 producing in a highly effective manner
SPE-212336-MS How And Where Wells Talk: Integrating Cross-well Strain and Production Profile Interference Testing, Figure 7
EVALUATE CLUSTER EFFICIENCY
Case Study 2
Stage level results summaries reveal production distribution across the lateral.
Correlate productivity to efficiency and landing zone or other geological features.
Lateral production profile with stage level results presented for well 22S. An apparent fault-like signature is noted in stage 14. A reduction in production volume and efficiency is noted from stages 6 to 3
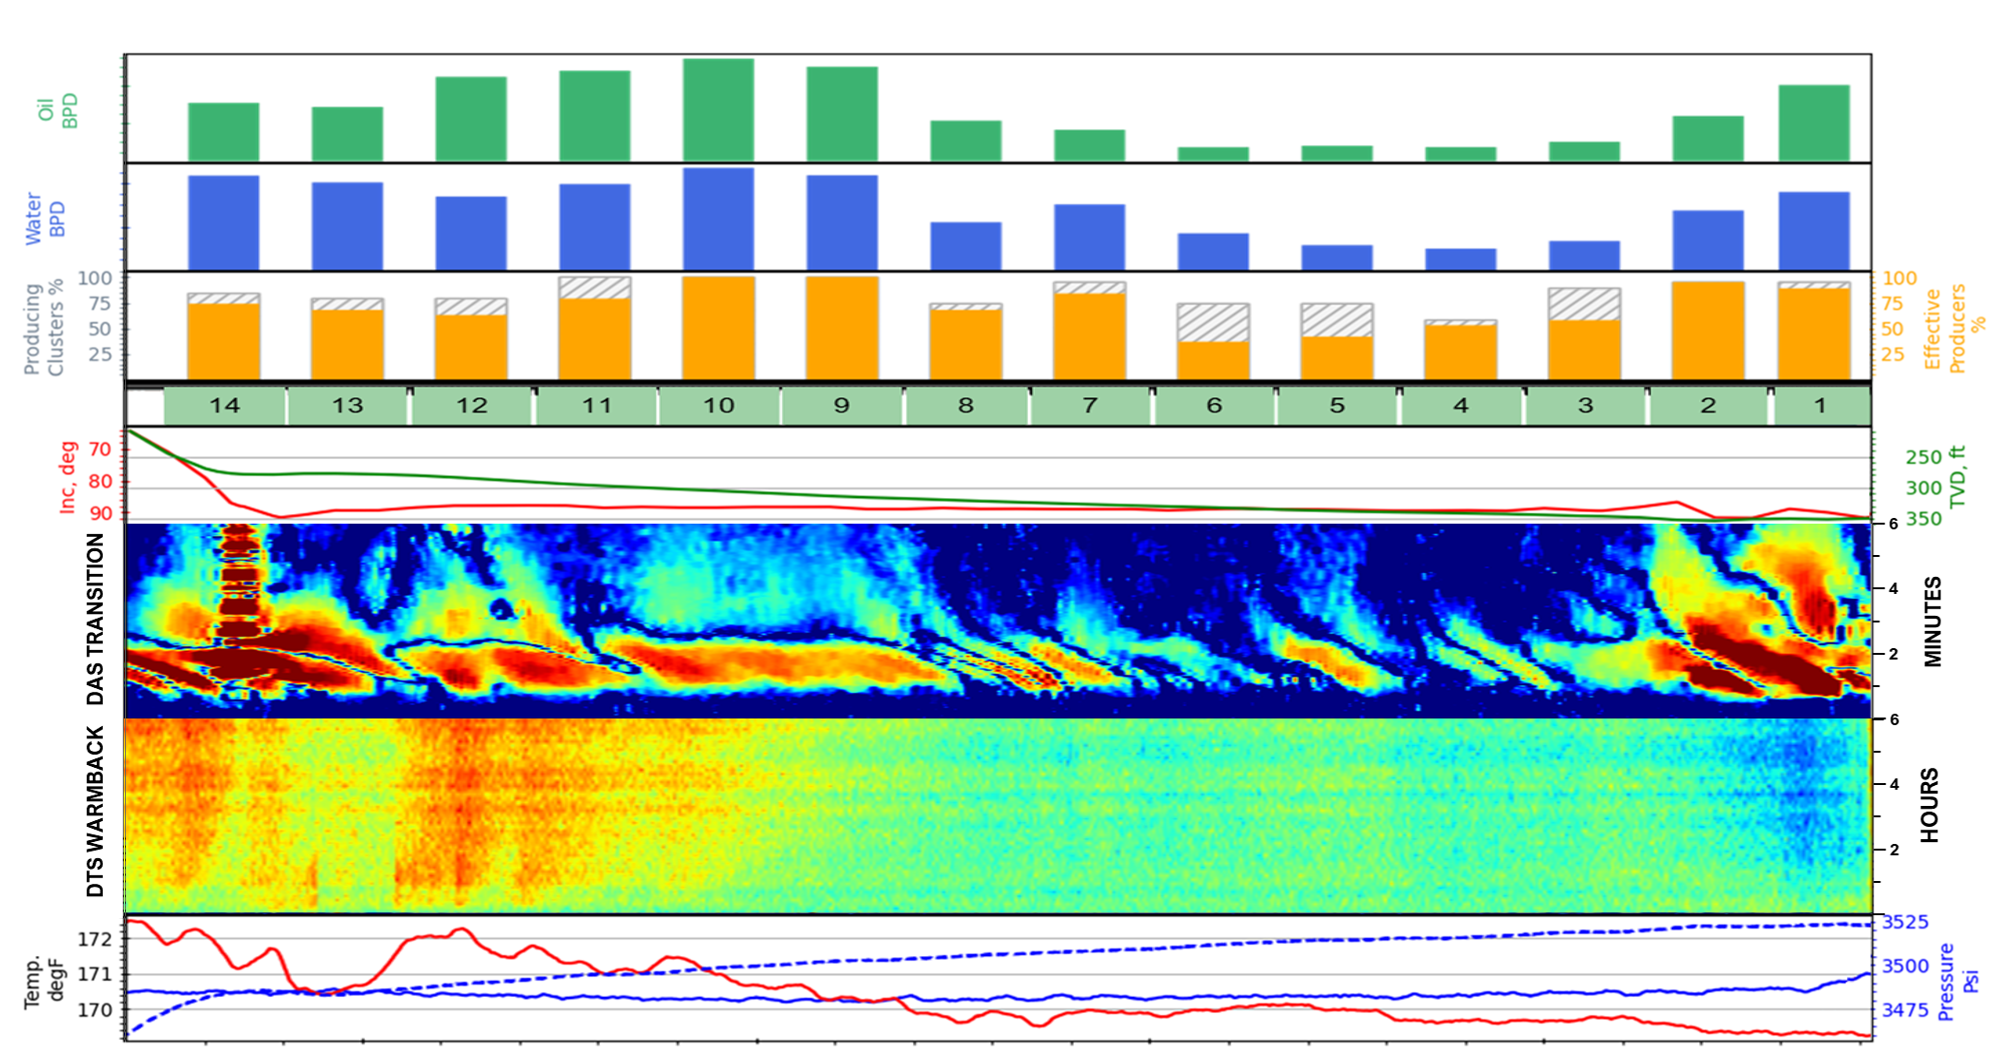
SPE-212336-MS How And Where Wells Talk: Integrating Cross-well Strain and Production Profile Interference Testing, Figure 8
INTERFERENCE WITH OFFSET WELL
Case Study 1
Understand where and how wells in stacked benches talk to each other to better inform well spacing and stimulation design decision-making.
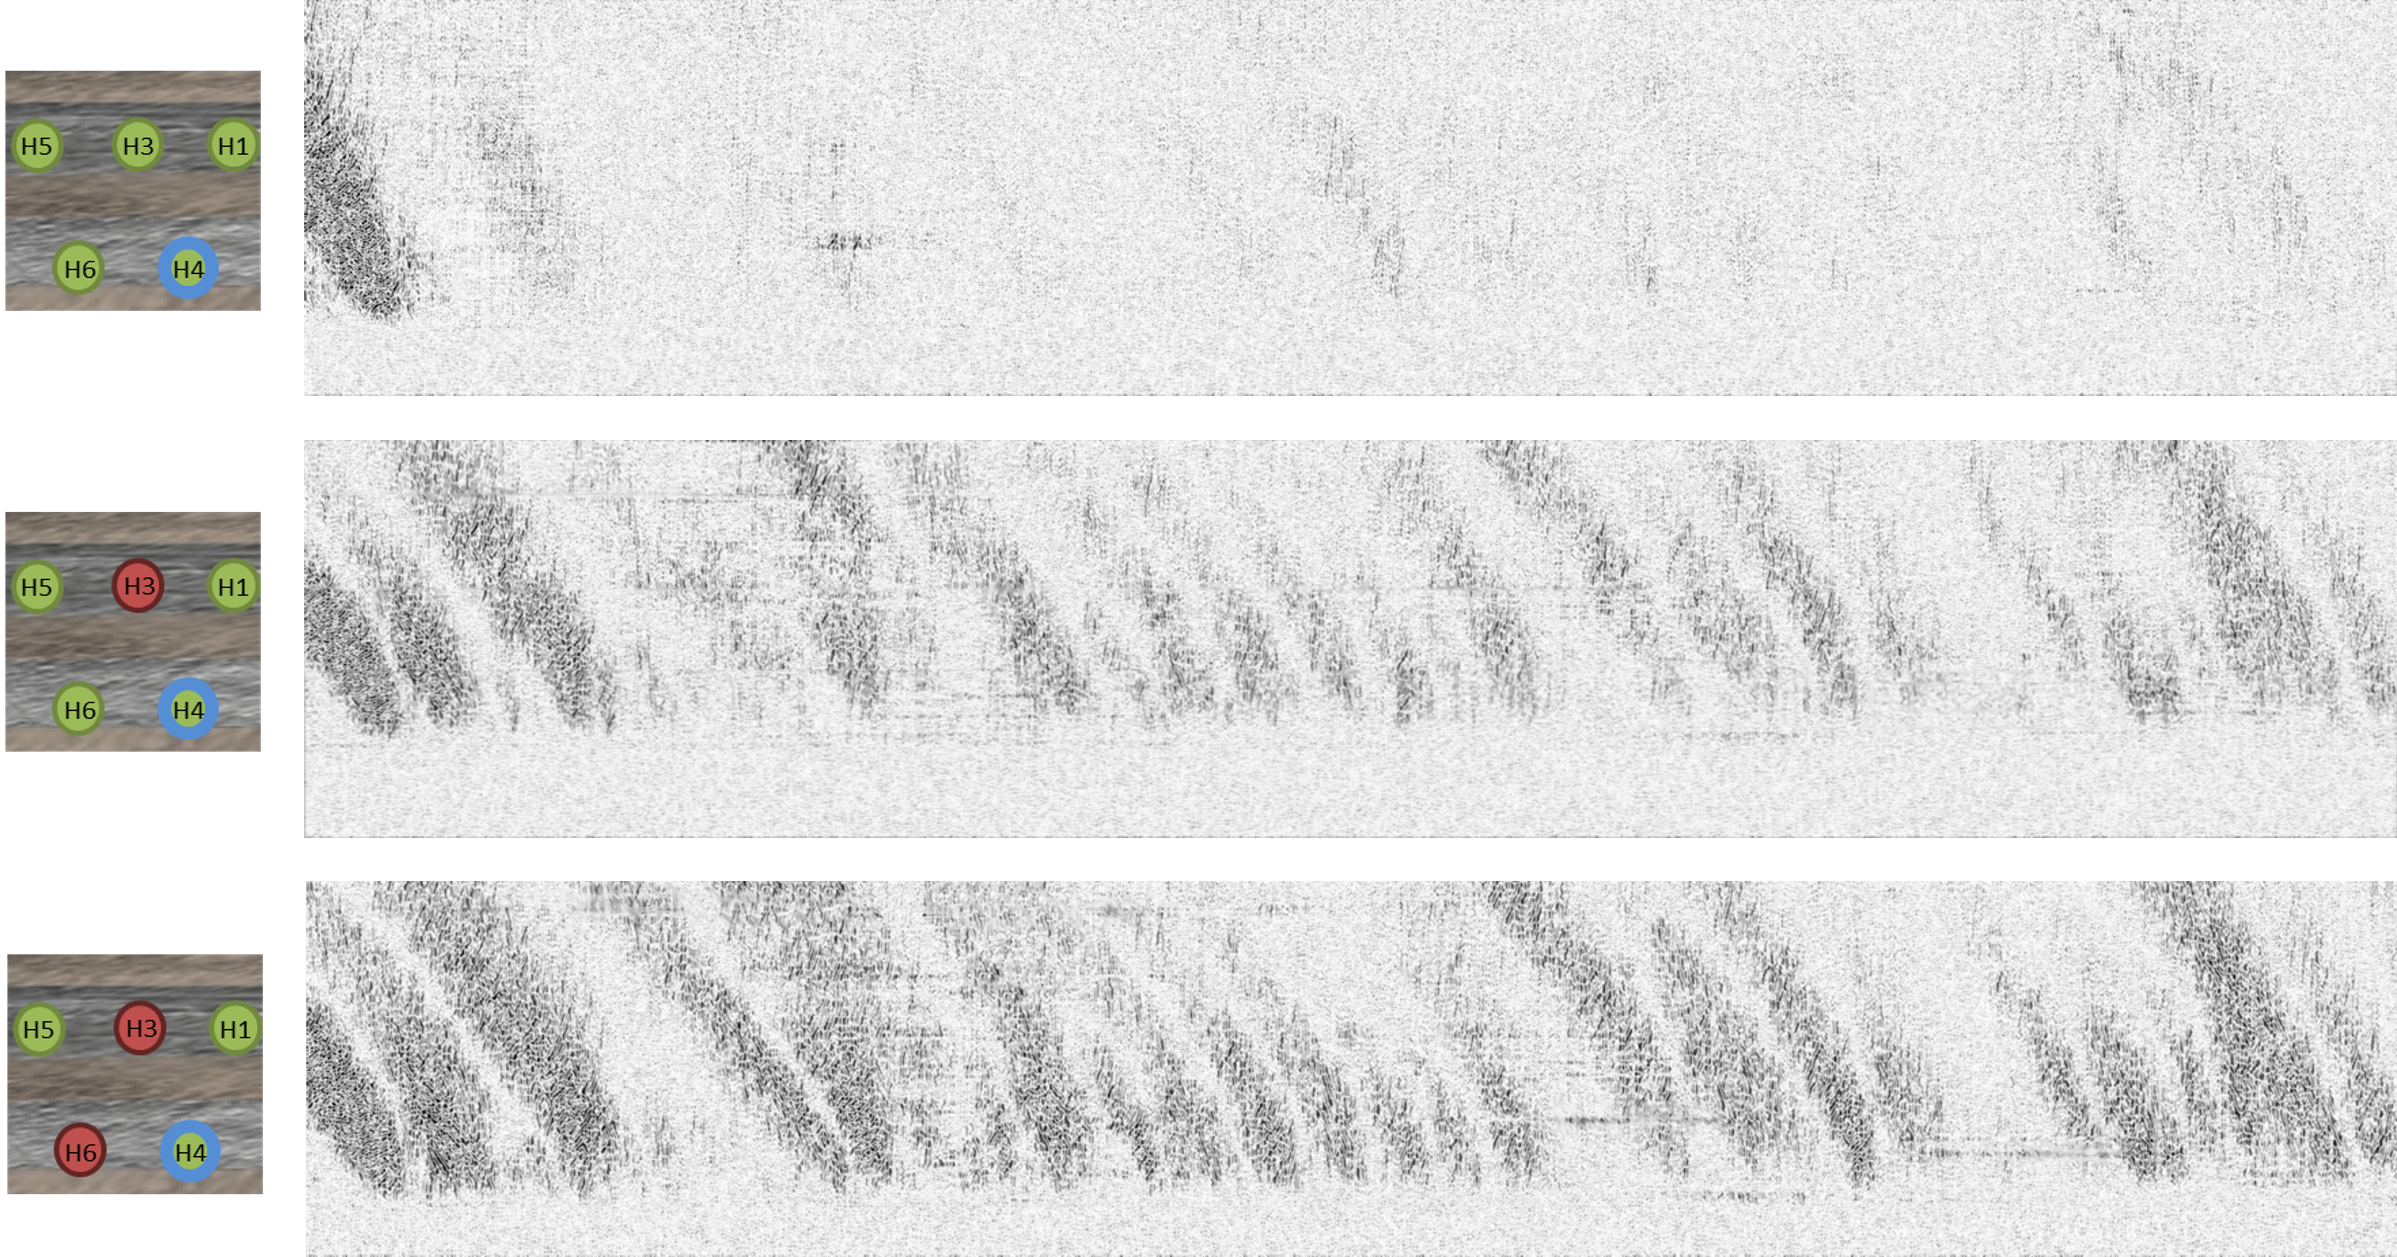
Understand where and how wells in stacked benches talk to each other to better inform well spacing and stimulation design decision-making.
REPEAT BASELINE
PROFILE
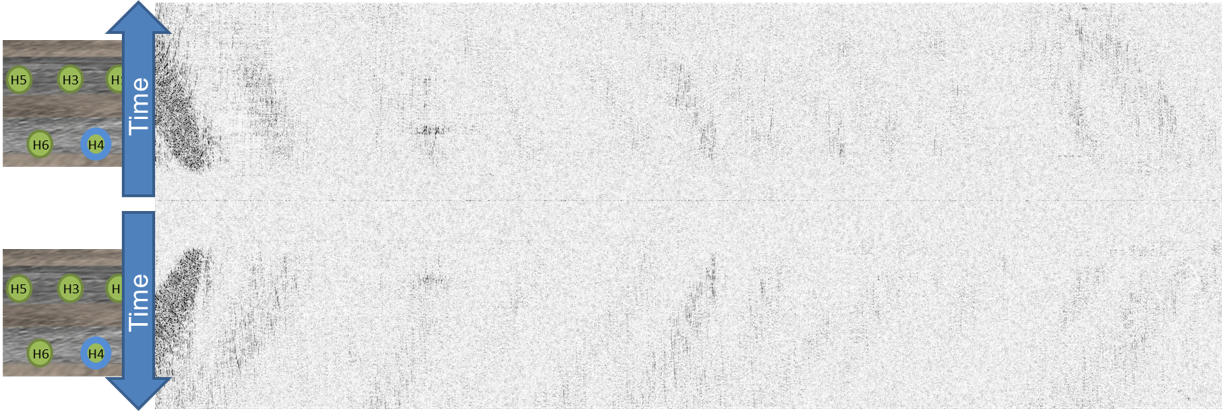
BASELINE PROFILE
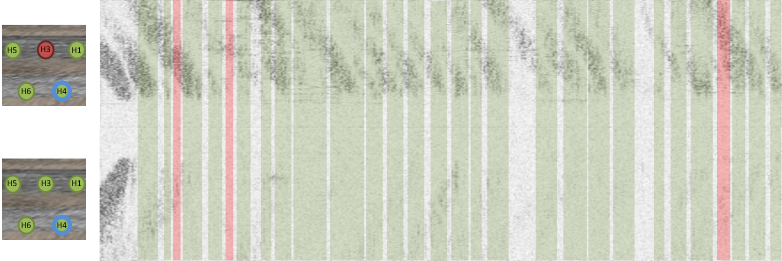
Repeatedly opening the well after a short shut-in period showed consistently poor performance across the lateral, but offset interference masked productive cluster efficiency.
INTERFERENCE REMOVED
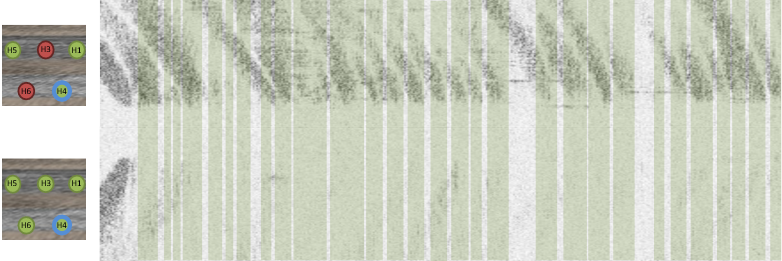
![]() BASELINE PROFILE
BASELINE PROFILE
The majority of the observed offset interference is revealed to be with the upper bench, where buoyant forces preferentially thieve production.
INTERFERENCE REMOVED
![]() BASELINE PROFILE
BASELINE PROFILE
INJECTION ALLOCATION
Case Study 1
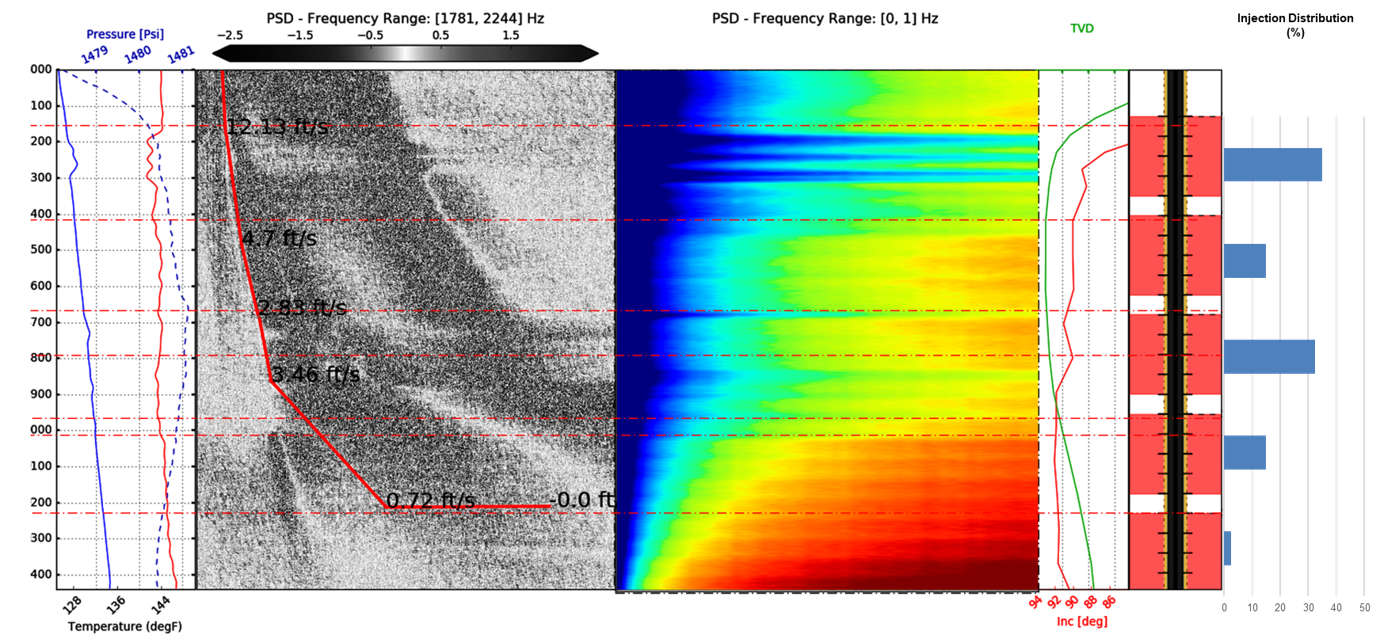
Understand and quantify injected fluid distribution.
Distributed acoustic and temperature data reveal fluid velocity and warm back behavior for a clear picture of injectivity.
INJECTION ALLOCATION
Case Study 1
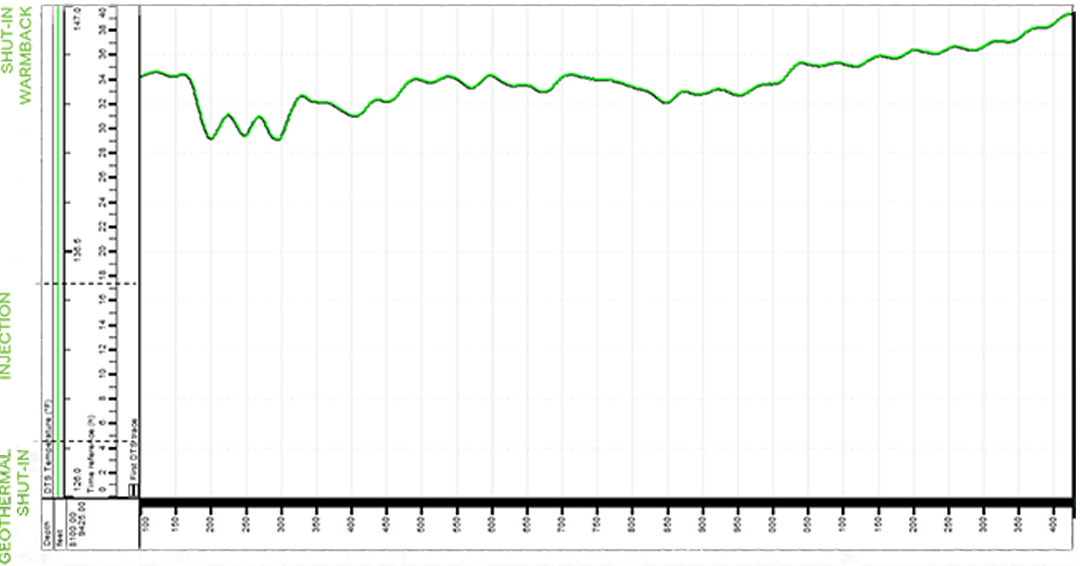
Observing how and where temperature changes along the lateral reveals where injected fluid is going.
REFRAC
Case Study 1
SAND DETECTION
Case Study 1
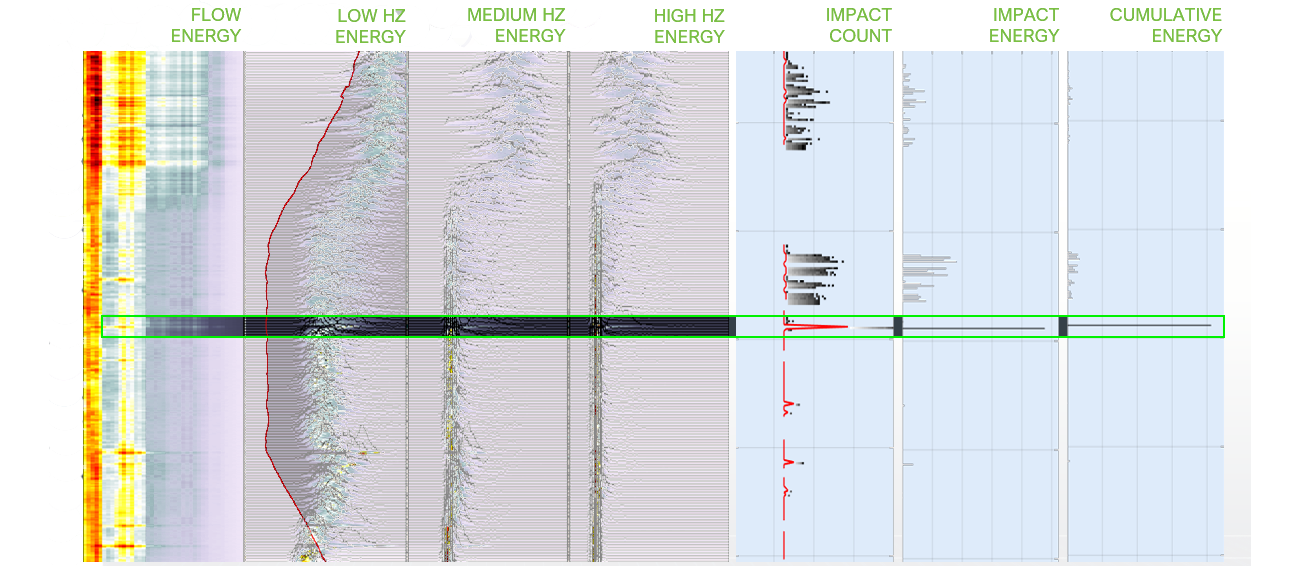
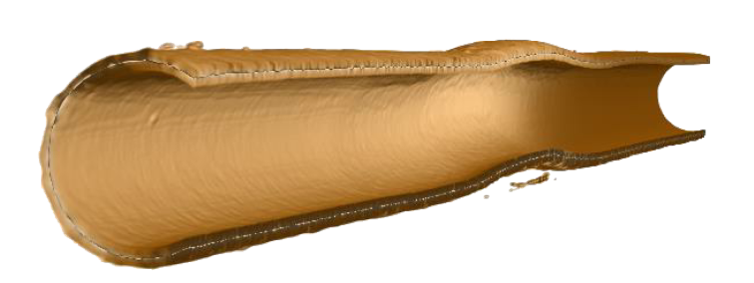
CASING DAMAGE
Case Study 1
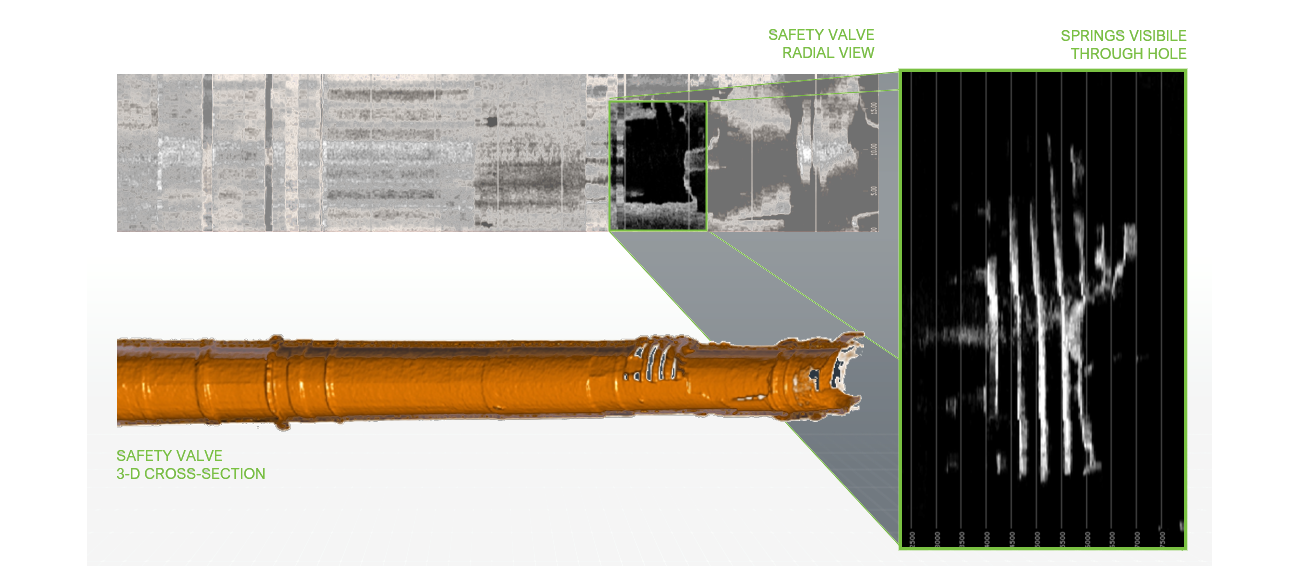
DOWNHOLE SAFETY VALVE DAMAGE
Case Study 1
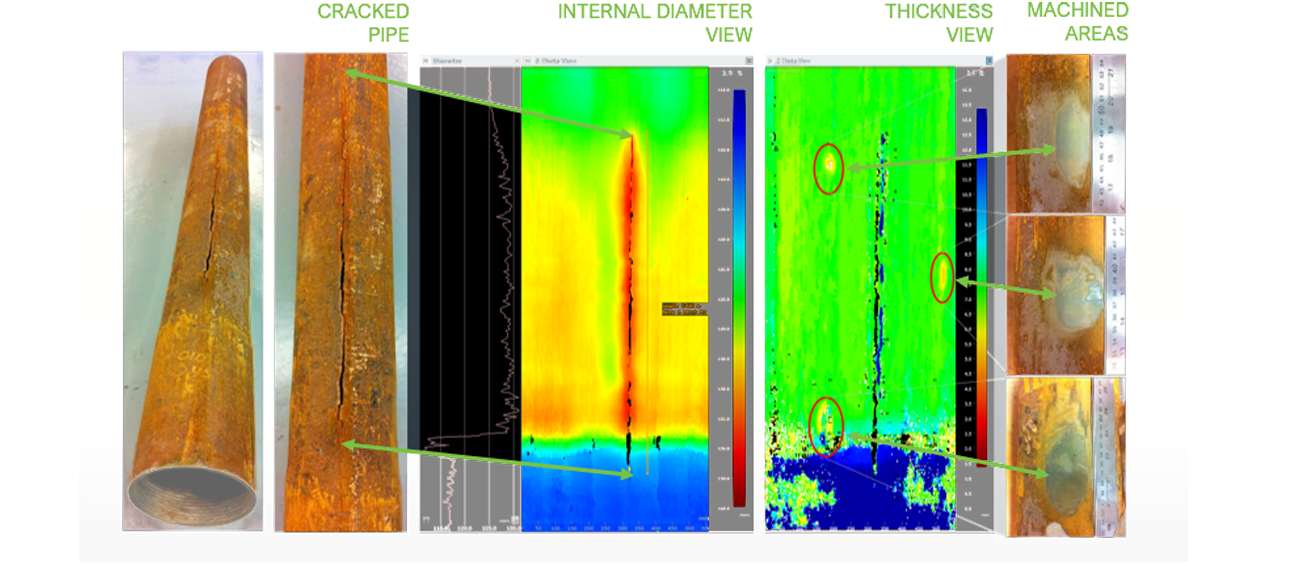
CASING DAMANGE
Case Study 2
PERFORATION EROSION
Case Study 1
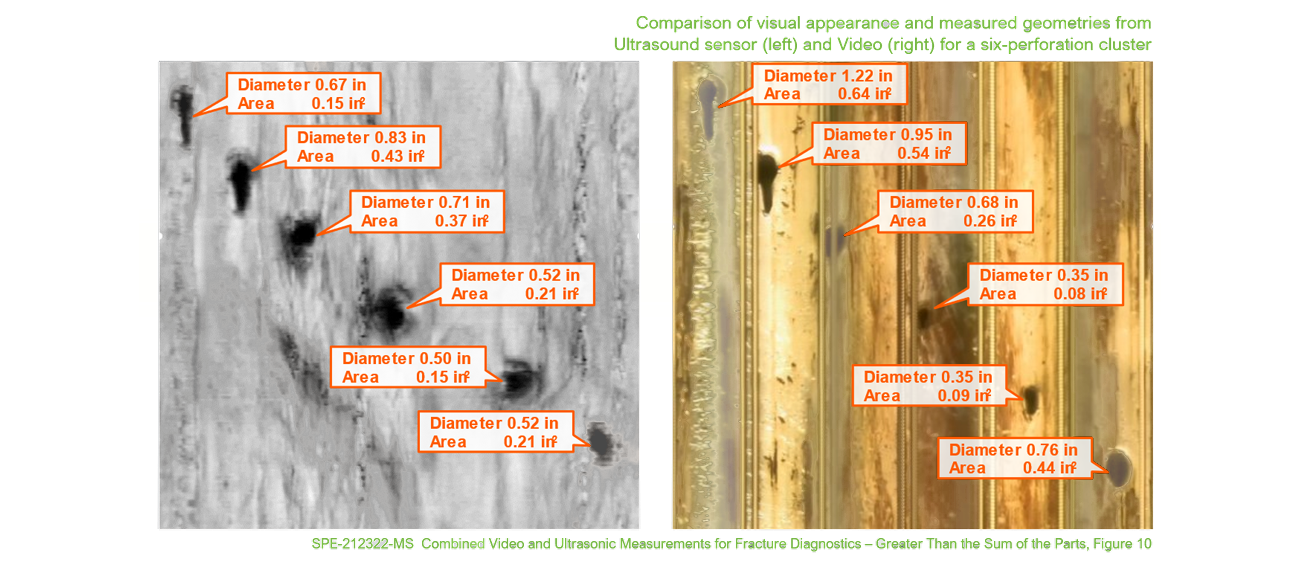
Ultrasonic imaging reveals perforation erosion and treatment non-uniformity.
CASING COLLAPSE
Case Study 18
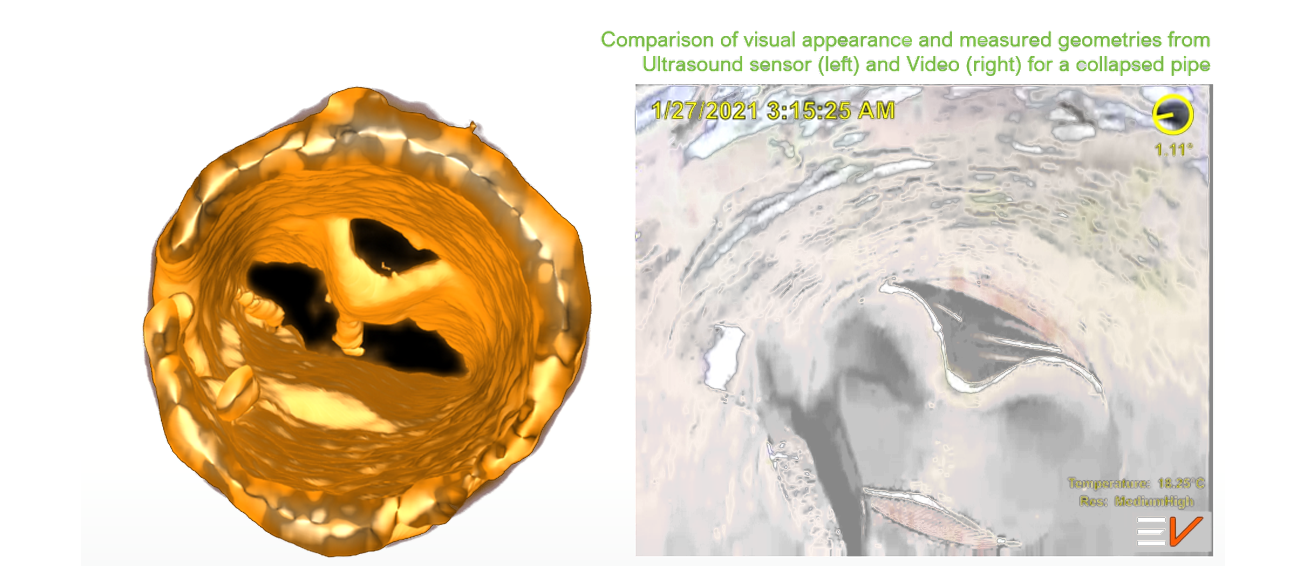
Ultrasonic imaging reveals wellbore obstructions and eliminates guesswork.
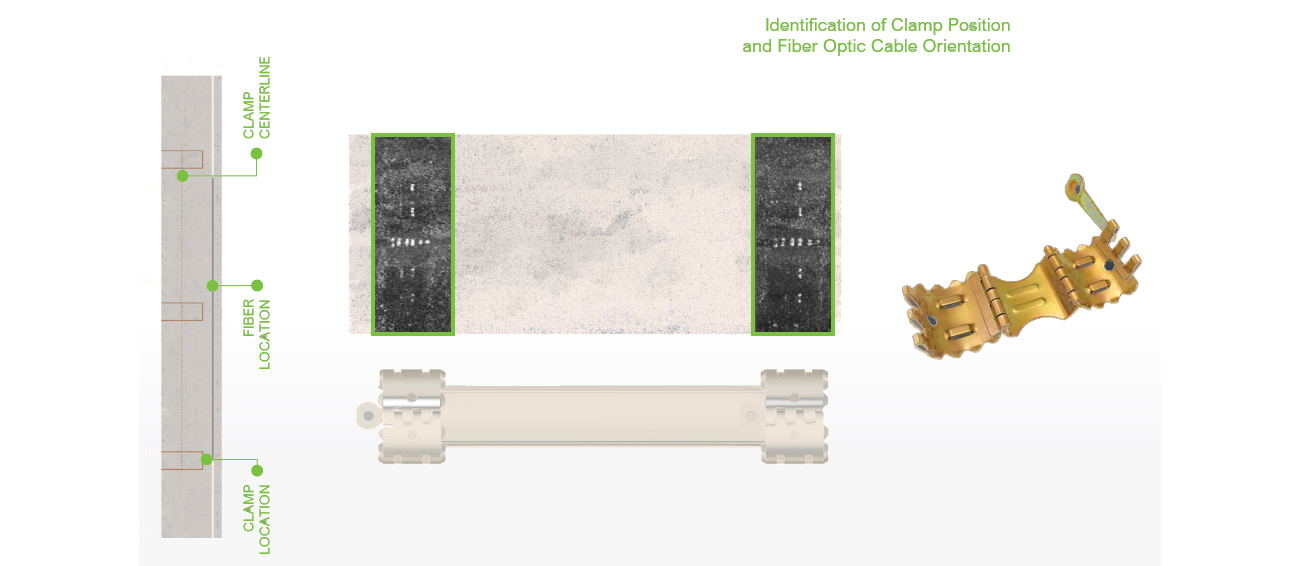
CLAMP OREINTATION
Case Study 19
Ultrasonic imaging reveals cable orientation for targeted perforating.
